In Use - Spectrograph
In real-life, however, you probably won't encounter nice steady wireless activity such as that produced by my IxChariot test script. That's where Wi-Spy's Spectrograph view will come in handy (Figure 8). This is essentially the same as the Cognio's Swept Spectrogram feature and is a great way to see when and at what frequencies RF activity is taking place.
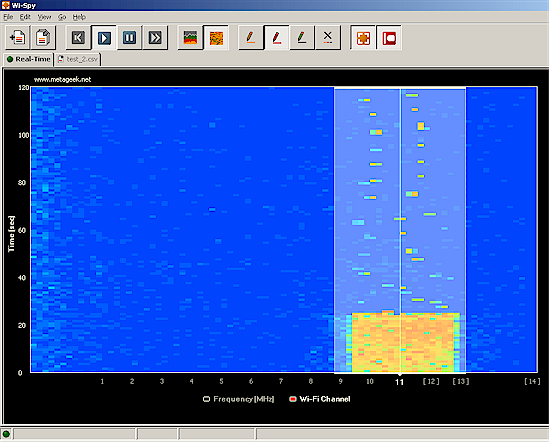
Figure 8 shows a Spectrograph of the test WLAN being idle, then being driven by the IxChariot script. The yellow area of the graph clearly indicates that something just lit up the airwaves! While you can't view both the Analyzer and Spectrograph views simultaneously, captured data is buffered, so you can easily switch back and forth between windows. The Spectrograph window can be set to display data over periods from 2 minutes to 24 hours.