Wireless Tests - WQS ranking
26 January 2006 Update - The following section has been revised and new WQS charts posted based on my confirmation of Airgo's assertion that the large downlink throughput spikes were due to IxChariot and Windows TCP/IP stack effects.
So how did the RM240 stack up against the other MIMO products that I recently tested? As expected, it topped the rankings on both a pure throughput and WQS basis. I'll present the Wireless Quality Score (WQS) rankings first.

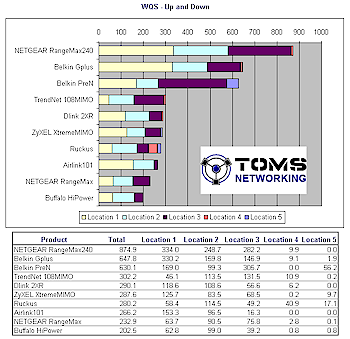
Figure 12: WQS ranking - Total up and downlink
(click image to enlarge)
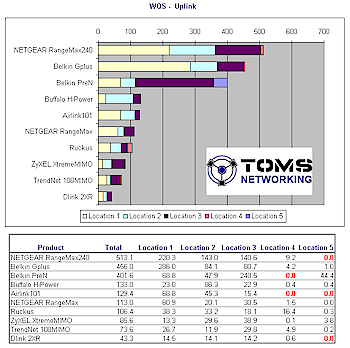
Figure 12 shows the total WQS rankings, which include both uplink and downlink tests. (WQS is calculated by adding together the Average Throughput divided by the Relative Precision for each test location.) So that you can see how downlink and uplink fared separately, I've broken them out into Figures 13 and 14 respectively.

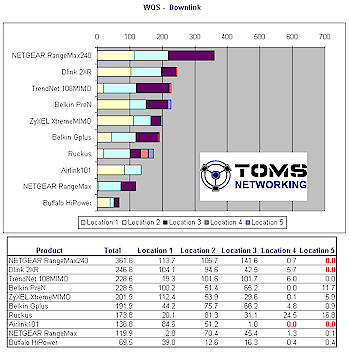
Figure 13: WQS ranking - Downlink
(click image to enlarge)
Even with the lack of any results for Location 5 as previously noted, downlink and uplink WQS tops the charts, mainly because of the significantly higher throughput in Locations 1-3
