Data Display and Manipulation
Once the survey is complete, you switch to Surveyor's Display mode to view the fruits of your labors. As you make the switch, you'll probably encounter a pop-up window asking you whether you want to specify the locations for the access points in your survey.
AirMagnet recommends you do this and I agree with their recommendation, since nailing down the APs' locations removes a variable from Surveyor's signal map generation algorithms and centers calculated peak signal areas on the APs instead of where Surveyor estimates the APs to be.
You can see the difference that adding the AP location information makes by examining Figures 10 and 11. The screenshots show two views of the same passive survey data from a test WLAN that included a Gigabype GN-A17GU 11g access point (red) and OvisLink WMU-9000VPN 11g VPN router (blue).
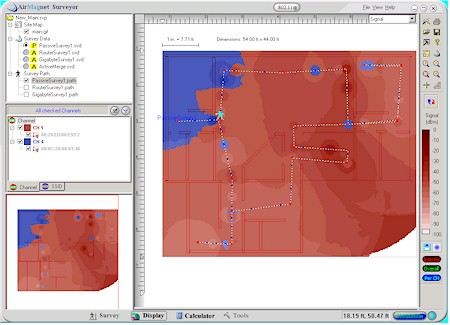
Figure 10: Passive Survey display - without APs specified
(click on the image for a larger view)
Figure 10 doesn't have the AP locations input and although it still accurately shows that the Channel 1 (red) AP is more powerful than the Channel 4 (blue) AP, you can't really see a defined signal center.
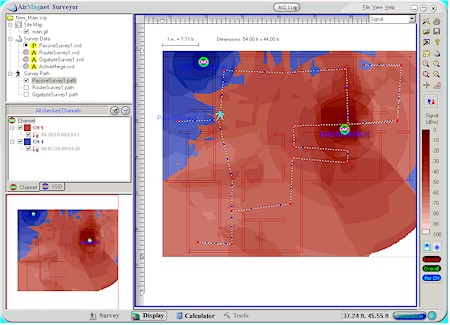
Figure 11: Passive Survey display - with APs located
(click on the image for a larger view)
Figure 11 shows that adding the AP locations produces definite signal centers and moves them to where the APs are actually located. Since the display algorithm always places the strongest AP's signal on top, you can see that the Gigabyte AP seems to overpower the OvisLink router. This is validated by the FCC test reports which list an average 802.11g mode peak power output of 62mW for the Gigabyte's Atheros-based radio vs. 34mW for the OvisLink's Conexant PRISM based radio.
It also looks like two APs are probably overkill to cover the 1500+ sq feet of my home's main level. But let's use one of Surveyor's nifty features to see if that's really true.
Figure 12 shows the display after removing Channel 4 (blue) data and adjusting the lower "range setter" (the vertical bar graph in the right-hand toolbar) to filter out Signal data below -65dBm.
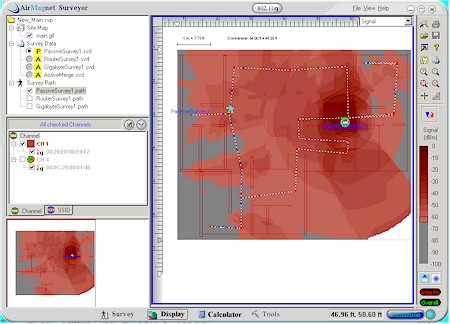
Figure 12: Passive Survey, Ch 1 only, -65dBm cutoff
(click on the image for a larger view)
The display now shows gray where the signal data falls below the -65dBm cutoff. I really like this feature because it gives color-challenged people like me who have trouble discerning shades of particular colors an easier way to understand the data. Note that the "range setter" feature also lets you adjust the high displayed data limit in case you want to filter out strong signal areas too.
With these display tweaks, you can see that the even the stronger Gigabyte AP won't cover my entire floor with a signal level that I've deemed acceptable. Since few client cards can provide a reliable (and fast enough) connection at very low signal levels, I found myself generally moving the lower "range setter" to the -70dBm or so level to look at usable signal levels.
Tip: In addition to the graphic output, you can also get a comma delimited listing of any survey's results by simply right-clicking on a Survey Data title and selecting Raw Data. The file format is plain ol' human readable text, perfect for perusal or importing into your favorite spreadsheet.
Walking in the prsenece of giants here. Cool thinking all around!